Abstract
Plastic waste accumulation in rural markets of developing countries constitutes a critical yet systematically understudied dimension of the global plastic pollution crisis. This study provides the first empirical quantification, characterization, and management assessment of plastic waste in three rural market sectors Kagano, Kanjongo, and Macuba in Nyamasheke District, Rwanda's Western Province. Employing a convergent mixed-methods design combining physical waste audits over 21 sessions, structured questionnaires administered to 400 respondents, key informant interviews, and focus group discussions, the study generated comprehensive market-level evidence on plastic waste generation rates, composition, disposal practices, environmental impacts, and governance gaps. Physical waste audits recorded a combined total of 20.5 kilograms and 7,625 plastic items across the 21-day audit period. Kagano sector generated the highest daily average at 1.66 kg/day, followed by Kanjongo at 0.89 kg/day and Macuba at 0.39 kg/day. Survey data revealed a mean self-reported generation of 3.01 plastic items per respondent per day, with vendors generating significantly more than consumers (t = 2.415, p = 0.016). PET bottles dominated the waste stream at 60.0% by weight, followed by wrappers and sachets at 34.6%. Plastic bags were completely absent from all audit sessions, confirming the sustained effectiveness of Rwanda's landmark 2008 single-use plastic ban. Burning (46.0%) and open dumping (33.5%) accounted for 79.5% of all disposal behavior, with waste segregation virtually absent among 98.5% of respondents. All five environmental impact indicators market littering, drainage blockage, soil and water contamination, air pollution, and livestock risk were observed in 100% of audit sessions. Chi-square analysis revealed highly significant sectoral variation in disposal practices (χ² = 55.333, p < 0.001). A critical awareness-behavior gap was documented: 99.2% of respondents were aware of the plastic ban, yet harmful disposal practices persisted across the study area. Based on these findings, the study proposes a multi-tiered, context-specific plastic waste management framework integrating Extended Producer Responsibility mechanisms, community-based collection infrastructure, sectoral enforcement, and behavioral change interventions. The findings provide actionable evidence to inform Rwanda's transition to a circular economy and offer a replicable methodology for rural market waste assessment across Sub-Saharan Africa.
Keywords
Plastic Waste, Waste Characterization, Waste Quantification, Rural Markets, Single-use Plastics, Nyamasheke District, Rwanda, Circular Economy
1. Introduction
The global plastic crisis has reached a critical inflection point. Annual global plastic production now surpasses 400 million metric tons, with approximately 35% manufactured for single-use purposes
| [29] | McDonough, W., & Braungart, M. (2002). Cradle to cradle: Remaking the way we make things. North Point Press. |
| [34] | Ngarambe, B., Uwimana, N., & Hategekimana, V. (2015). Effectiveness of Rwanda’s plastic bag ban. Environmental Development, 15, 34–42. |
[29, 34]
. Of this production, only 9% is recycled, 12% is incinerated, and 79% accumulates in landfills or the natural environment
| [5] | Borrelle, S. B., Ringma, J., Law, K. L., Monnahan, C. C., Lebreton, L., McGivern, A., Murphy, E., Jambeck, J., Leonard, G. H., Hilleary, M. A., Eriksen, M., Possingham, H. P., De Frond, H., Gerber, L. R., Polidoro, B., Tahir, A., Bernard, M., Mallos, N., Barnes, M., & Rochman, C. M. (2020). Predicted growth in plastic waste exceeds efforts to mitigate plastic pollution. Science, 369(6510), 1515–1518.
https://doi.org/10.1126/science.aba3656 |
| [13] | Geyer, R., Jambeck, J. R., & Law, K. L. (2017). Production, use, and fate of all plastics ever made. Science Advances, 3(7), e1700782. |
[5, 13]
generating a cascade of ecological, public health, and socioeconomic consequences that demand urgent, evidence-based policy responses. Jambeck et al.
| [23] | Jambeck, J. R., Geyer, R., Wilcox, C., Siegler, T. R., Perryman, M., Andrady, A., & Law, K. L. (2015). Plastic waste inputs from land into the ocean. Science, 347(6223), 768–771. |
[23]
estimated that 8 million metric tons of plastic waste entered the world’s oceans in 2010 alone, with the greatest contributions from countries where waste management systems are inadequate. The ecological consequences are compounding: plastic degradation produces microplastics particles under 5mm now ubiquitous in all major ocean basins, freshwater systems, soils, and even the atmosphere
| [7] | Chang, X., Xue, Y., Li, J., Zou, L., & Tang, M. (2020). Potential health impact of environmental micro- and nanoplastics pollution. Journal of Applied Toxicology, 40(1), 4–15.
https://doi.org/10.1002/jat.3915 |
| [8] | Cole, M., Lindeque, P., Halsband, C., & Galloway, T. S. (2011). Microplastics as contaminants in the marine environment: A review. Marine Pollution Bulletin, 62(12), 2588–2597. |
| [10] | de Souza Machado, A. A., Kloas, W., Zarfl, C., Hempel, S., & Rillig, M. C. (2018). Microplastics as an emerging threat to terrestrial ecosystems. Global Change Biology, 24(4), 1405–1416. |
| [21] | Izuagba, I., Okoye, C., & Udeh, J. (2019). Plastic waste generation and management practices in Nigerian cities. Waste Management, 85, 295–304. |
[7, 8, 10, 21]
.
The burden of plastic pollution falls disproportionately on low- and middle-income countries in Sub-Saharan Africa and Southeast Asia, where per capita mismanaged plastic waste significantly exceeds global averages and formal waste management infrastructure remains chronically underdeveloped
| [27] | Lebreton, L., & Andrady, A. (2019). Future scenarios of global plastic waste generation and disposal. Marine Pollution Bulletin, 142, 189–199. |
[27]
. In Africa, approximately 90% of solid waste is disposed of at uncontrolled sites with associated open burning, against an overall recycling rate of only 4% far below the African Union’s target of 50% urban recycling by 2023
| [11] | Deme, G. G., Ewusi-Mensah, D., Olagbaju, O. A., Andriessen, H., Assuah, A., Isimbi, A. E., Sintim, E. G., Little-Tetteh, C., Addo, F. G., & Ewusi-Mensah, D. (2022). Macro problems from microplastics: Toward a sustainable policy framework for managing microplastic waste in Africa. Science of the Total Environment, 804, 150170.
https://doi.org/10.1016/j.scitotenv.2021.150170 |
| [17] | Guerrero, L. A., Maas, G., & Hogland, W. (2013). Solid waste management challenges for cities in developing countries. Waste Management, 33(1), 220–232. |
| [24] | Kaza, S., Yao, L. C., Bhada-Tata, P., & Van Woerden, F. (2018). What a waste 2.0: A global snapshot of solid waste management to 2050. Urban Development Series. World Bank. https://doi.org/10.1596/978-1-4648-1329-0 |
[11, 17, 24]
. Rural markets across the continent represent critical yet systematically overlooked nodes of plastic waste generation: they concentrate large volumes of packaged goods within confined spaces, generate disproportionate quantities of packaging waste relative to their size, and lack formal waste collection infrastructure
| [2] | Auta, H. S., Emenike, C. U., & Fauziah, S. H. (2018). Distribution and importance of microplastics in the marine environment: A review. Environmental Pollution, 237, 489–500. |
| [25] | Kothari, C. R. (2004). Research methodology: Methods and techniques (2nd ed.). New Age International. |
[2, 25]
.
Rwanda is internationally recognized as an environmental policy leader in Africa, having enacted one of the continent’s earliest and most comprehensive bans on single-use plastic bags in 2008. Research confirmed that the ban reduced plastic bag litter in Kigali by over 60% within its first years of implementation
| [34] | Ngarambe, B., Uwimana, N., & Hategekimana, V. (2015). Effectiveness of Rwanda’s plastic bag ban. Environmental Development, 15, 34–42. |
[34]
. Subsequently, Law No. 17/2019 extended prohibitions to plastic straws, food containers, and disposable cutlery. Despite these legislative achievements, persistent challenges with other plastic types particularly PET bottles, food wrappers, and sachets remain unresolved, especially in rural and peri-urban areas where enforcement capacity is weaker, alternatives less accessible, and cross-border trade introduces additional plastic packaging streams
| [3] | Behuria, P. (2021). Ban the (plastic) bag? Explaining variation in the implementation of plastic bag bans in Rwanda, Kenya and Uganda. Environment and Planning C: Politics and Space, 39(8), 1791–1808. https://doi.org/10.1177/2399654421994836 |
| [15] | Global Plastics Policy Centre. (2023). The state of global plastic policy. University of Portsmouth.
https://www.globalplasticspolicycentre.com |
| [16] | Government of Rwanda. (2019). Law N° 17/2019 of 10/08/2019 relating to the prohibition of manufacturing, importation, use and sale of plastic carry bags and single use plastics. Official Gazette of the Republic of Rwanda. |
| [32] | Mugenda, O. M., & Mugenda, A. G. (2003). Research methods: Quantitative and qualitative approaches. ACTS Press. |
| [35] | Niyonzima, D., & Manirakiza, V. (2022). Enforcement outcomes of Rwanda's plastic-ban policy in rural markets. Journal of Environmental Management, 324, 116–130. |
[3, 15, 16, 32, 35]
. The Rwanda Environment Management Authority
| [30] | Mhlongo, S., Dube, T., & Moyo, P. (2020). Urban plastic waste dynamics in South Africa. Waste Management & Research, 38(5), 502–511. |
[30]
explicitly acknowledges limited data on rural plastic waste as a key constraint on effective national policy implementation.
Nyamasheke District, located in Rwanda’s Western Province on the shores of Lake Kivu and bordering the Democratic Republic of Congo (DRC), exemplifies this governance gap. Its rural markets in Kagano, Kanjongo, and Macuba sectors are active nodes of cross-border and domestic trade, generating significant volumes of plastic packaging waste that is poorly managed. Yet no empirical quantification of plastic waste has previously been conducted in this district. As Parashar and Hait
emphasize, effective plastic waste management systems cannot be designed without prior characterization and quantification; without this evidence base, policymakers and local authorities are unable to design targeted, cost-effective interventions. This study therefore seeks to fill this critical evidence gap.
The objectives of this study are fourfold: (i) to quantify the daily generation of plastic waste in Kagano, Kanjongo, and Macuba sectors; (ii) to characterize the types and sources of dominant plastic waste categories; (iii) to assess existing waste management practices and identify institutional and behavioral gaps; and (iv) to design a context-specific plastic waste management framework integrating institutional, infrastructure, and behavioral change strategies. The findings generate the first quantitative baseline for plastic waste in Nyamasheke District and contribute to the growing literature on rural market waste dynamics in Sub-Saharan Africa, offering a replicable methodology for comparable contexts across the continent. This study is grounded in four theoretical perspectives that collectively explain the drivers, dynamics, and governance requirements of plastic waste management in rural market settings.
Circular Economy Theory, as articulated by McDonough and Braungart
| [29] | McDonough, W., & Braungart, M. (2002). Cradle to cradle: Remaking the way we make things. North Point Press. |
[29]
and elaborated by Geissdoerfer et al.
| [12] | Geissdoerfer, M., Savaget, P., Bocken, N. M. P., & Hultink, E. J. (2017). The circular economy — A new sustainability paradigm? Journal of Cleaner Production, 143, 757–768. |
[12]
, provides the overarching rationale for the management framework. Rather than treating plastic waste as an inevitable by-product of market activity, this theory repositions it as a material resource whose value can be recovered through reduction, reuse, and recycling, thereby decoupling economic activity from environmental harm
| [22] | Jackson, T. (2014). Prosperity without growth: Foundations for the economy of tomorrow. Routledge. |
[22]
. Applied in the Nyamasheke context, circular economy principles underpin recommendations for Extended Producer Responsibility, deposit-return schemes, and material recovery infrastructure.
Waste Management Theory, as synthesized by Wilson et al.
| [39] | Ochieng, G., Ndegwa, S., & Kamau, P. (2021). Impact of Kenya's plastic bag ban on urban waste streams. Environmental Science & Policy, 120, 45–55. |
[39]
, emphasizes that effective waste systems must be tailored to the specific socioeconomic, institutional, and infrastructural contexts in which they operate, rather than relying on standardized, top-down approaches. This theoretical lens is particularly relevant in rural market settings characterised by informality, limited infrastructure, and diverse stakeholder interests.
Environmental Stewardship Theory underscores the collective responsibility of individuals, communities, institutions, and governments to manage the environment sustainably. Applied to this study, it provides the rationale for engaging vendors, consumers, local authorities, and producers as co-managers of plastic waste rather than merely subjects of regulation, fostering a sense of shared accountability for environmental outcomes in market settings.
Behavioral Change Theory, drawing on Ajzen’s
| [1] | Ajzen, I. (1991). The theory of planned behavior. Organizational Behavior and Human Decision Processes, 50(2), 179–211. |
[1]
Theory of Planned Behavior and White, Habib, and Hardisty’s
| [38] | OECD. (2022). Global plastics outlook: Policy scenarios to 2060. OECD Publishing. |
[38]
synthesis of behavioral interventions, posits that sustainable environmental behavior is shaped by attitudes, subjective social norms, and perceived behavioral control. Understanding what drives vendors and consumers to use and dispose of plastics in particular ways is essential for designing effective behavioral interventions awareness campaigns, economic incentives, and provision of accessible alternatives that can complement regulatory and infrastructure measures.
2. Materials and Methods
2.1. Study Area
The study was conducted in Nyamasheke District, Western Province, Rwanda, situated on the shores of Lake Kivu and sharing a border with the Democratic Republic of Congo. This border location makes Nyamasheke a significant node of cross-border trade, which substantially influences the volume and composition of packaged goods and by extension plastic waste circulating through its markets. Three sectors were purposively selected: Kagano, Kanjongo, and Macuba. These sectors were chosen on the basis of their commercial significance, active market economies, documented challenges with plastic waste accumulation, and the diversity of their vendor-consumer compositions. Each sector hosts regular market days that draw vendors, consumers, and suppliers from surrounding areas, creating peak periods of waste generation.
2.2. Research Design
A convergent mixed-methods research design was employed, combining quantitative and qualitative approaches to generate a comprehensive, multi-dimensional understanding of plastic waste dynamics. As Creswell and Plano Clark
| [9] | Creswell, J. W. (2014). Research design: Qualitative, quantitative, and mixed methods approaches (4th ed.). SAGE Publications. |
[9]
explain, mixed-methods designs are particularly appropriate when research problems require both the breadth of statistical analysis and the depth of qualitative interpretation. The simultaneous collection and integration of quantitative audit and survey data with qualitative KII and FGD data enabled methodological triangulation, strengthening the credibility and validity of findings.
2.3. Target Population and Sample
The target population comprised vendors and consumers active in the rural markets of the three study sectors, with a total estimated population of 5,943 individuals based on market registration records and sector administration estimates. The sample size was determined using Slovin's formula (n = N / (1 + N × e²)), applied at a 5% margin of error, yielding a minimum required sample of 374 respondents, rounded up to 400 to account for potential non-responses and to enhance statistical robustness. The sample was distributed proportionally across sectors and across vendor and consumer groups: 160 vendors (40%) and 240 consumers (60%), reflecting the demographic ratio of market actors. Stratified random sampling ensured proportional representation, with systematic sampling (every 15th individual, k ≈ 15) applied within each sector. Key informants sector environmental officers, market managers, waste collectors, and health officers were selected purposively, with six per sector (18 total). Two focus group discussions of ten vendors each were conducted per sector (six FGDs in total).
2.4. Data Collection Instruments
Four instruments were employed: structured questionnaires administered to all 400 respondents to collect quantitative data on plastic generation, usage patterns, and disposal practices; standardized physical waste audit field sheets used to sort, count, and weigh plastic waste by predefined category (PET bottles, wrappers/sachets, rigid plastics, and plastic bags) over seven consecutive audit days per sector using calibrated digital scales; semi-structured key informant interview guides providing qualitative insights into institutional practices and enforcement challenges; and focus group discussion guides exploring shared vendor experiences, attitudes, and behavioral norms
| [26] | Krueger, R. A., & Casey, M. A. (2015). Focus groups: A practical guide for applied research (5th ed.). SAGE Publications. |
| [31] | Morgan, D. L. (1997). Focus groups as qualitative research (2nd ed.). SAGE Publications. |
[26, 31]
. All instruments were pre-tested with a non-sample group and revised based on pilot feedback
| [20] | Israel, M. (2014). Research ethics and integrity for social scientists (2nd ed.). SAGE Publications. |
[20]
. Physical waste audits were conducted over seven consecutive days per sector (21 audit days in total) to capture both market-day and non-market-day variability. Plastic waste was collected from defined market zones, sorted into the four predefined categories, individually counted, and weighed using calibrated scales. Daily generation rates were calculated per sector, and category-level composition data expressed as percentages of total weight and total item count. Auditor inter-rater reliability was established through training and cross-checking between audit assistants
| [37] | Nunnally, J. C. (1978). Psychometric theory (2nd ed.). McGraw-Hill. |
[37]
.
2.5. Data Analysis
Quantitative data were entered into Microsoft Excel for initial cleaning before importation into SPSS version 26. Analytical methods included: descriptive statistics (frequencies, means, standard deviations, percentages) for waste generation rates and disposal practices; an independent-samples t-test to compare vendor and consumer daily plastic item generation rates; one-way ANOVA to test for significant differences in per-respondent plastic generation across sectors; chi-square analysis to assess the association between sector location and disposal method; and per-capita waste generation calculations in kilograms per day and items per day. Qualitative data from KIIs and FGDs were transcribed and analyzed using Braun and Clarke’s
| [4] | Braun, V., & Clarke, V. (2006). Using thematic analysis in psychology. Qualitative Research in Psychology, 3(2), 77–101. |
[4]
six-step thematic analysis, with emerging themes triangulated with quantitative findings during interpretation.
3. Results
3.1. Respondent Profile
The sample of 400 respondents comprised 160 vendors (40.0%) and 240 consumers (60.0%), distributed across Macuba (189 respondents, 47.2%), Kanjongo (120 respondents, 30.0%), and Kagano (91 respondents, 22.8%). This proportional distribution reflects relative sector market sizes. The majority of respondents (82.7%) had at least one year of market experience, with 32.3% having between four and seven years providing a well-established empirical base for assessing plastic waste patterns and behavioral norms.
Table 1. Distribution of respondents by sector.
Sector | Frequency | Percentage (%) |
Kagano | 91 | 22.8 |
Kanjongo | 120 | 30.0 |
Macuba | 189 | 47.2 |
Total | 400 | 100.0 |
3.2. Plastic Waste Quantification
3.2.1. Physical Waste Audit Results
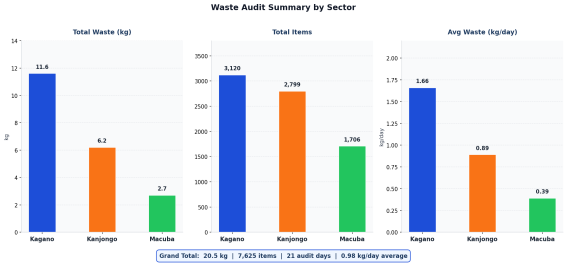
Across 21 audit sessions (seven per sector), a combined total of 20.5 kilograms and 7,625 plastic items were collected and recorded. Kagano generated the highest total and daily average, with 11.6 kg collected over seven days and a mean daily generation rate of 1.66 kg/day. Kanjongo recorded a total of 6.2 kg and a daily average of 0.89 kg/day. Macuba generated the lowest measured volume at 2.7 kg, averaging 0.39 kg/day. The higher generation rate in Kagano is attributable to its position along key cross-border trade routes connecting Nyamasheke to the DRC, which drives a higher volume and variety of packaged goods through its market sites. These findings are consistent with Brooks, Wang, and Jambeck
| [6] | Brooks, A. L., Wang, S., & Jambeck, J. R. (2018). The Chinese import ban and its impact on global plastic waste trade. Science Advances, 4(6), eaat0131. |
[6]
, who documented elevated plastic waste at markets along active trade corridors.
Figure 1. Plastic Waste Generation by Sector Physical Audit Summary (kg/day).
3.2.2. Self-Reported Generation Rates
Survey respondents reported a mean of 3.01 plastic items generated per person per day (SD = 0.19). Wrappers/sachets and PET bottles dominated, each recording means of approximately 1.00 and 0.99 items respectively. Plastic bags recorded a negligible mean of 0.02, reflecting the sustained impact of the 2008 ban. An independent-samples t-test confirmed that vendors generated significantly more plastic items per day (mean = 3.04) than consumers (mean = 2.99), t (398) = 2.415, p = 0.016, consistent with vendors' role as active packagers and distributors in market transactions.
Table 2. Mean daily plastic items per respondent by category.
Respondent Group | Plastic Bags | PET Bottles | Sachets | Wrappers |
Vendors (n=160) | 0.06 | 0.98 | 1.00 | 1.00 |
Consumers (n=240) | 0.00 | 0.99 | 1.00 | 1.00 |
Overall Mean (n=400) | 0.02 | 0.99 | 1.00 | 1.00 |
Source: Primary data, January–February 2026
3.2.3. Inter-Sector Comparison
One-way ANOVA found no statistically significant difference in self-reported per-respondent plastic item generation across sectors (F (2, 397) = 1.950, p = 0.144), with all three sectors recording sector means of 3.00 to 3.04. This indicates that per-respondent consumption patterns are structurally homogeneous across the study area, even while total audit volumes differ substantially a discrepancy explained by variation in total market population size and commercial intensity rather than individual behavioral differences.
3.3. Plastic Waste Characterization
Physical waste audits revealed a consistent and reproducible plastic waste composition across all three sectors. PET bottles dominated by weight, accounting for 12.3 kg (60.0%) of the 20.5 kg total. Wrappers and sachets constituted 7.1 kg (34.6%) by weight and 4,410 items (57.8%) by count the largest category by item volume. Rigid plastics accounted for 1.1 kg (5.4%), recorded only in Kagano. Plastic bags were entirely absent from all 21 audit sessions a finding of significant policy relevance, confirming that Rwanda’s 2008 ban has achieved near-complete suppression of plastic bag use even in remote rural markets, corroborating Ngarambe et al.
| [34] | Ngarambe, B., Uwimana, N., & Hategekimana, V. (2015). Effectiveness of Rwanda’s plastic bag ban. Environmental Development, 15, 34–42. |
[34]
. Across sectors, PET bottles comprised between 57.8% and 63.0% of waste by weight and wrappers/sachets between 32.8% and 37.1%, indicating structural consistency in the plastic waste stream.
Survey data aligned closely with audit findings: 95.8% of all 400 respondents identified supplier packaging and vendor distribution practices as the primary source of plastic waste. Only 4.2% attributed the main source to consumer behavior. This supply-chain attribution is consistent with Hopewell, Dvorak, and Kosior
| [19] | Hopewell, J., Dvorak, R., & Kosior, E. (2009). Plastics recycling: Challenges and opportunities. Philosophical Transactions of the Royal Society B, 364(1526), 2115–2126. |
[19]
, who identify packaging at the point of sale as the principal driver of plastic waste in informal market environments
| [36] | Njeru, J. (2006). The urban political ecology of plastic-bag waste problem in Nairobi, Kenya. Geoforum, 37(6), 1046–1058. |
[36]
, and reinforces the argument for upstream Extended Producer Responsibility interventions rather than consumer-focused behavioral campaigns alone.
Table 3. Plastic waste characterization by type.
Plastic Waste Type | Weight (kg) | % by Weight | Item Count | % by Count |
PET Bottles | 12.3 | 60.0% | 3,192 | 41.9% |
Wrappers/Sachets | 7.1 | 34.6% | 4,410 | 57.8% |
Rigid Plastics | 1.1 | 5.4% | 23 | 0.3% |
Plastic Bags | 0.0 | 0.0% | 0 | 0.0% |
Grand Total | 20.5 | 100.0% | 7,625 | 100.0% |
Source: Waste audit field data, January–February 2026
3.4. Existing Waste Management Practices
3.4.1. Disposal Methods
Table 4 presents the distribution of disposal methods among all 400 respondents. Burning was the most prevalent practice overall (46.0%), followed by open dumping (33.5%). Together, these two harmful practices accounted for 79.5% of all reported disposal behavior. Formal use of collection bins or designated collection systems accounted for only 11.2% of respondents, and reuse or repurposing for 9.2%. Consumers were significantly more likely to burn plastic (52.5% vs. 36.2% of vendors), while vendors showed higher rates of formal collection use (16.2% vs. 7.9% of consumers), reflecting differences in waste volume, proximity to bins, and commercial incentives between the two groups.
Table 4. Plastic Waste Disposal Methods by Respondent Category (n = 400).
Disposal Method | Overall n (%) | Vendors n (%) | Consumers n (%) |
Burning | 184 (46.0%) | 58 (36.2%) | 126 (52.5%) |
Open Dumping | 134 (33.5%) | 59 (36.9%) | 75 (31.2%) |
Collection / Bins | 45 (11.2%) | 26 (16.2%) | 19 (7.9%) |
Reuse / Repurpose | 37 (9.2%) | 17 (10.6%) | 20 (8.3%) |
Total | 400 (100%) | 160 (100%) | 240 (100%) |
Source: Primary data, January–February 2026
Chi-square analysis demonstrated a highly statistically significant association between sector location and disposal method (χ²(6, n=400) = 55.333, p < 0.001), confirming that disposal behavior is not uniformly distributed. Burning was most prevalent in Kanjongo (65.8%), where waste bins were absent in three of seven audit sessions. Open dumping was highest in Kagano (37.4%), reflecting the volume and velocity of commercial activity in that sector. Macuba showed the most varied distribution with the highest rate of bin use (13.8%), suggesting marginally better infrastructure provision. These sector-specific patterns strongly support differentiated, sector-level intervention strategies rather than uniform district-wide approaches.
3.4.2. Waste Segregation
Waste segregation was virtually absent across the study area. An overwhelming 394 respondents (98.5%) reported no practice of separating plastic waste from other solid waste at the point of generation. Only six respondents (1.5%) reported any segregation behavior. Physical audit observations corroborated this finding: only two of 21 audit sessions (9.5%) recorded any observable segregation at market sites. Macuba recorded a 0% segregation rate across all survey respondents. Without source segregation, plastic waste is co-mingled with organic and other solid waste, rendering downstream recovery and recycling economically and practically unviable.
3.4.3. Waste Infrastructure
Waste disposal bins were present in 15 of 21 audit sessions (71.4%), with full presence in all seven Kagano sessions and three-session absences in both Kanjongo and Macuba. However, the presence of bins alone did not correspond with reduced harmful disposal: 46% of respondents continue to burn plastic even where bins are present. Audit observers noted that existing bins were poorly positioned, inadequate in number relative to market scale, rarely emptied, and not designated specifically for plastic waste confirming that infrastructure provision, without complementary behavioral incentives and institutional maintenance, is insufficient to change disposal outcomes.
3.4.4. The Awareness-Behavior Gap
A paradoxical and policy-critical finding emerged regarding awareness: 397 respondents (99.2%) reported awareness of Rwanda’s national plastic bag ban, with near-complete awareness across all three sectors. Despite this, 79.5% of respondents relied on harmful disposal methods and 98.5% did not segregate waste. This awareness-behavior gap is a defining finding of the study, confirming that knowledge is a necessary but insufficient driver of behavioral change a finding consistent with White, Habib, and Hardisty
| [38] | OECD. (2022). Global plastics outlook: Policy scenarios to 2060. OECD Publishing. |
[38]
and with behavioral change theory more broadly. Structural enablers, accessible infrastructure, economic incentives, and credible enforcement are all necessary complements to information-based interventions.
3.5. Environmental Impacts
All five environmental impact indicators documented in the standardized audit checklist were observed in all 21 audit sessions, representing a 100% prevalence rate across the entire study period and across all three sectors (
Table 5).
The universality of these environmental harms is the most alarming evidence generated by the study. Open burning, confirmed by both field observation and 46% of survey respondents, releases toxic compounds including dioxins, furans, and volatile organic compounds with well-documented respiratory and systemic health impacts
| [34] | Ngarambe, B., Uwimana, N., & Hategekimana, V. (2015). Effectiveness of Rwanda’s plastic bag ban. Environmental Development, 15, 34–42. |
[34]
. Drainage blockage from lightweight wrappers and sachets creates structural flooding risks during Nyamasheke’s high-rainfall periods. Accumulation of plastic in open ground and water bodies drives progressive soil and water contamination through microplastic fragmentation a pattern confirmed in Rwandan and broader Sub-Saharan African contexts
| [9] | Creswell, J. W. (2014). Research design: Qualitative, quantitative, and mixed methods approaches (4th ed.). SAGE Publications. |
| [18] | Hendricks, C., Olatunji, A., & Gumbi, B. (2024). Microplastics in African aquatic systems: Sources, risks, and management strategies. Journal of Environmental Sciences, 115, 45–57. |
| [30] | Mhlongo, S., Dube, T., & Moyo, P. (2020). Urban plastic waste dynamics in South Africa. Waste Management & Research, 38(5), 502–511. |
[9, 18, 30]
. The universal observation of livestock exposure to plastic waste documents an additional dimension of harm extending to animal welfare and household food security in this predominantly agrarian district.
Table 5. Prevalence of Environmental Impact Indicators across Audit Sessions (n = 21).
Environmental Impact Indicator | Sessions Observed (n) | Total Sessions | % Observed |
Market littering and poor aesthetics | 21 | 21 | 100% |
Blocked drainage and flooding risk | 21 | 21 | 100% |
Soil and water contamination (microplastics) | 21 | 21 | 100% |
Air pollution from open burning | 21 | 21 | 100% |
Risk to livestock from plastic ingestion | 21 | 21 | 100% |
Source: Waste audit field observations, January–February 2026
4. Discussion
4.1. Quantification: Establishing a First Baseline
The physical audit data 20.5 kg and 7,625 items across 21 sessions provides the first quantitative baseline for plastic waste generation in Nyamasheke District, directly addressing the evidence gap identified by Jambeck et al.
| [23] | Jambeck, J. R., Geyer, R., Wilcox, C., Siegler, T. R., Perryman, M., Andrady, A., & Law, K. L. (2015). Plastic waste inputs from land into the ocean. Science, 347(6223), 768–771. |
[23]
, Niyonzima and Manirakiza
| [35] | Niyonzima, D., & Manirakiza, V. (2022). Enforcement outcomes of Rwanda's plastic-ban policy in rural markets. Journal of Environmental Management, 324, 116–130. |
[35]
, and REMA
| [30] | Mhlongo, S., Dube, T., & Moyo, P. (2020). Urban plastic waste dynamics in South Africa. Waste Management & Research, 38(5), 502–511. |
[30]
. The audit-derived daily rates (1.66, 0.89, and 0.39 kg/day for Kagano, Kanjongo, and Macuba respectively) reflect the combined effects of market size, population density, and commercial intensity particularly cross-border trade in Kagano rather than individual behavioral differences, as confirmed by the statistically non-significant ANOVA result (F = 1.950, p = 0.144). The methodology adopted in this study combining physical audit measurements with self-reported survey data provides a model for future rural market waste assessments, as recommended by Wilson et al.
| [39] | Ochieng, G., Ndegwa, S., & Kamau, P. (2021). Impact of Kenya's plastic bag ban on urban waste streams. Environmental Science & Policy, 120, 45–55. |
[39]
, capturing both objective generation rates and behavioral drivers within a single, integrated design.
4.2. Characterization: PET Bottles and Sachets as Policy Targets
The dominance of PET bottles (60.0% by weight) and wrappers/sachets (34.6% by weight), combined with the complete absence of plastic bags, generates several important policy insights. First, it confirms that Rwanda’s 2008 ban represents a genuine and sustained behavioral and market-level shift, extending even to remote rural markets a finding that strengthens the evidence base for policy continuity and for extending bans to comparable material categories
| [14] | Global Green Growth Institute (GGGI). (2023). Rwanda plastic waste management and recycling: Field visit report. GGGI Publications. |
[14]
. Second, it identifies PET bottles and sachets as the priority targets for future regulatory and waste management investment. Third, the overwhelming attribution of waste to supplier packaging practices (95.8% of respondents) reinforces theoretical arguments from the circular economy framework that effective intervention must address upstream packaging design and supply chain accountability, not merely downstream disposal. This finding aligns with Uwimana et al.
| [33] | Mugenzi, G., Nshimiyimana, J. C., & Uwimana, A. (2023). Economic and operational impacts of Rwanda’s plastic ban on manufacturing businesses. Journal of Environmental Policy & Planning, 25(3), 312–328. |
[33]
and points directly to Extended Producer Responsibility as the most structurally impactful policy tool available.
4.3. Management Failures: Infrastructure, Behavior, and Institutions
The co-occurrence of near-universal awareness of the plastic ban (99.2%) with near-universal harmful disposal (79.5%) and near-complete absence of segregation (98.5%) constitutes the central governance paradox of this study. It confirms that regulatory awareness campaigns, however successful in generating knowledge, cannot substitute for the material conditions necessary to make sustainable behavior the default choice: accessible and maintained bin infrastructure; reliable, affordable waste collection services; economic incentives for separation and recovery; and credible, consistent enforcement. This finding is consistent with Behavioral Change Theory
| [1] | Ajzen, I. (1991). The theory of planned behavior. Organizational Behavior and Human Decision Processes, 50(2), 179–211. |
| [38] | OECD. (2022). Global plastics outlook: Policy scenarios to 2060. OECD Publishing. |
[1, 38]
, Waste Management Theory
| [39] | Ochieng, G., Ndegwa, S., & Kamau, P. (2021). Impact of Kenya's plastic bag ban on urban waste streams. Environmental Science & Policy, 120, 45–55. |
[39]
, and with broader evidence from Sub-Saharan Africa
| [2] | Auta, H. S., Emenike, C. U., & Fauziah, S. H. (2018). Distribution and importance of microplastics in the marine environment: A review. Environmental Pollution, 237, 489–500. |
[2]
, and has direct implications for how the proposed management framework must be designed.
The statistically significant sectoral variation in disposal practices (χ² = 55.333, p < 0.001) is equally important: it demonstrates that plastic waste governance in Nyamasheke cannot be addressed through a uniform district-wide approach but requires sector-differentiated interventions responding to the distinct commercial, infrastructural, and behavioral profiles of each sector. Kanjongo's burning dominance demands priority bin installation and enforcement; Kagano's open-dumping challenge requires trade-route-specific collection infrastructure; Macuba's relatively more varied disposal offers a platform to build and incentivize positive behavioral change.
4.4. Environmental Consequences
The 100% prevalence of all five environmental impact indicators across all audit sessions is a stark empirical statement: plastic waste mismanagement in Nyamasheke’s rural markets is not a marginal or episodic problem but a structural and pervasive feature of the current system. Open burning the dominant disposal practice releases a complex mixture of toxic compounds with chronic health implications for the tens of thousands of market workers and nearby residents who are repeatedly exposed
| [34] | Ngarambe, B., Uwimana, N., & Hategekimana, V. (2015). Effectiveness of Rwanda’s plastic bag ban. Environmental Development, 15, 34–42. |
[34]
. Drainage blockage amplifies the district’s already-elevated flood risk. Microplastic contamination of soils and the waters of Lake Kivu threatens both agricultural productivity and drinking water quality in a district where livelihoods are intimately tied to these natural systems. These harms are not merely environmental in the abstract; they are human development and food security challenges with direct bearing on Rwanda’s Vision 2050 goals and its commitments under SDG 3 (Health), SDG 12 (Responsible Consumption), and SDG 14 (Life Below Water).
4.5. Proposed Plastic Waste Management Framework
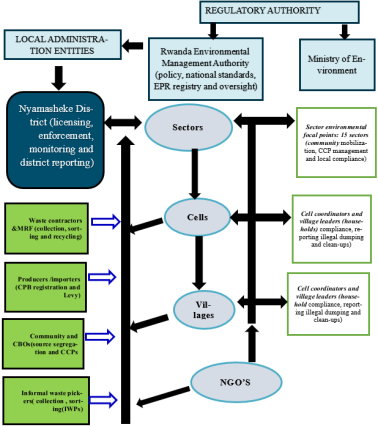
Based on the study's evidence, a multi-tiered, context-specific plastic waste management framework is proposed for Nyamasheke District. The framework integrates institutional arrangements, physical infrastructure, and behavioral change strategies across three governance levels.
At the national level, REMA and the Ministry of Environment provide overall regulatory authority, set national waste management standards, manage the Extended Producer Responsibility (EPR) registry, and mandate producers and importers of PET bottles, sachets, and food wrappers to contribute to a national plastic waste management fund proportional to materials placed on the market. A PET bottle deposit-return scheme, piloted in Nyamasheke District and calibrated using this study's generation data, would provide direct economic incentives for collection while generating sustained financing for rural market infrastructure.
Figure 2. Proposed Plastic waste management framework for Nyamasheke District.
At the district and sector level, Nyamasheke District's Environmental Management Unit is responsible for licensing waste operators, enforcing compliance with market waste management by-laws, monitoring sector-level performance using the standardized audit methodology developed by this study, and compiling quarterly environmental reports. Fifteen sector environmental focal points serve as the operational bridge between district authority and community-level actors, coordinating waste collection schedules, monitoring bin maintenance, and managing sector-level compliance.
At the community and market level, formal Waste Management Committees established in each market sector comprising sector environmental focal points, market managers, vendor representatives, and community leaders provide participatory governance over waste management performance. Designated market wardens conduct daily monitoring of disposal practices and enforce the prohibition of open burning, with graduated penalty provisions. Color-coded, sector-positioned communal segregation bins with reliable emptying schedules and financial provisions for maintenance are installed at all stall clusters. Vendor permit renewal is made conditional on completion of a brief orientation covering segregation practices, disposal requirements, and the public health consequences of open burning. A Green Market certification scheme, offering formal recognition and reduced permit fees for compliant vendors, provides positive behavioral incentives aligned with the stewardship theory framework.
Informal waste pickers (IWPs), who play a critical and underappreciated role in bridging formal collection gaps, are formally integrated into the framework through registration, training, and linkage to Material Recovery Facilities (MRFs) enabling them to capture economic value from PET bottle and rigid plastic recovery while contributing to measurable reductions in environmental leakage. Community-based organizations (CBOs) operate community collection points (CCPs) as intermediate accumulation sites for sorted plastics pending collection by licensed waste contractors.
This framework is deliberately calibrated to the evidence generated by this study: PET bottle and wrapper/sachet recovery as the priority material streams; Kanjongo as the priority sector for bin installation; Kagano as the priority for trade-route collection interventions; and the awareness-behavior gap as the justification for coupling all infrastructure and regulatory measures with sustained, peer-delivered behavioral change programming.
5. Conclusions
This study provides the first comprehensive, empirical assessment of plastic waste generation, characterization, disposal, and environmental impacts in the rural markets of Nyamasheke District, Rwanda. The key conclusions are as follows.
Daily plastic waste generation across the three study sectors is a significant and measurable phenomenon, with Kagano recording the highest daily generation (1.66 kg/day) due to cross-border commercial intensity. Self-reported per-respondent generation of 3.01 items/day is structurally homogeneous across sectors, confirming that differences in total audit volumes reflect population and market size rather than individual behavioral variation.
PET bottles and wrappers/sachets dominate the plastic waste stream (94.6% by weight combined). The complete absence of plastic bags from all 21 audit sessions constitutes robust empirical confirmation of Rwanda's 2008 ban's sustained effectiveness in rural markets a finding with significant implications for the evidence base supporting ban continuity and extension.
Existing waste management practices are wholly inadequate: 79.5% of respondents rely on burning or open dumping, waste segregation is virtually absent (98.5%), and the provision of bins alone is insufficient to change disposal behavior. Sector-specific intervention is essential, given statistically significant inter-sector variation in disposal practices (χ² = 55.333, p < 0.001).
An acute awareness-behavior gap persists: near-universal awareness of the plastic ban (99.2%) has not translated into behavioral change, confirming that regulatory knowledge cannot substitute for accessible infrastructure, economic incentives, and credible enforcement.
All five environmental impact indicators were universally observed across all audit sessions, confirming that plastic waste mismanagement in Nyamasheke's rural markets constitutes a systemic public health and environmental governance emergency demanding urgent multi-stakeholder action.
The proposed multi-tiered management framework integrating EPR financing, deposit-return mechanisms, formal Waste Management Committees, sector-differentiated infrastructure, informal sector integration, and behavioral incentives provides an evidence-based, practically feasible pathway toward sustainable plastic waste governance in rural Rwanda.
The study's findings contribute to the international literature on rural market waste dynamics, offer a replicable mixed-methods methodology for comparable assessments across Sub-Saharan Africa, and provide the evidence base for Rwanda's transition toward circular economy governance at the district level.
Abbreviations
BOD | Biological Oxygen Demand |
CBO | Community-Based Organization |
CCP | Community Collection Point |
DRC | Democratic Republic of Congo |
EPR | Extended Producer Responsibility |
FGD | Focus Group Discussion |
IWP | Informal Waste Picker |
KII | Key Informant Interview |
MRF | Material Recovery Facility |
PET | Polyethylene Terephthalate |
REMA | Rwanda Environment Management Authority |
SDG | Sustainable Development Goal |
UNILAK | University of Lay Adventists of Kigali |
WHO | World Health Organization |
Acknowledgments
The authors express sincere gratitude to the local authorities and community members of Nyamasheke District particularly those in Kagano, Kanjongo, and Macuba sectors for their cooperation and openness throughout the fieldwork. Appreciation is also extended to the administration and academic staff of UNILAK for their institutional support, and to all research assistants who conducted waste audits.
Author Contributions
Ntabugi Marie Assoumpta: Conceptualization, Data curation, Formal Analysis, Investigation, Methodology, Validation, Writing – original draft, Writing – review & editing
Pancras Ndokoye: Supervision, Writing – review & editing
Erasmus Atusasire: Resources, Writing – review & editing
Conflicts of Interest
The authors declare no conflicts of interest.
References
| [1] |
Ajzen, I. (1991). The theory of planned behavior. Organizational Behavior and Human Decision Processes, 50(2), 179–211.
|
| [2] |
Auta, H. S., Emenike, C. U., & Fauziah, S. H. (2018). Distribution and importance of microplastics in the marine environment: A review. Environmental Pollution, 237, 489–500.
|
| [3] |
Behuria, P. (2021). Ban the (plastic) bag? Explaining variation in the implementation of plastic bag bans in Rwanda, Kenya and Uganda. Environment and Planning C: Politics and Space, 39(8), 1791–1808.
https://doi.org/10.1177/2399654421994836
|
| [4] |
Braun, V., & Clarke, V. (2006). Using thematic analysis in psychology. Qualitative Research in Psychology, 3(2), 77–101.
|
| [5] |
Borrelle, S. B., Ringma, J., Law, K. L., Monnahan, C. C., Lebreton, L., McGivern, A., Murphy, E., Jambeck, J., Leonard, G. H., Hilleary, M. A., Eriksen, M., Possingham, H. P., De Frond, H., Gerber, L. R., Polidoro, B., Tahir, A., Bernard, M., Mallos, N., Barnes, M., & Rochman, C. M. (2020). Predicted growth in plastic waste exceeds efforts to mitigate plastic pollution. Science, 369(6510), 1515–1518.
https://doi.org/10.1126/science.aba3656
|
| [6] |
Brooks, A. L., Wang, S., & Jambeck, J. R. (2018). The Chinese import ban and its impact on global plastic waste trade. Science Advances, 4(6), eaat0131.
|
| [7] |
Chang, X., Xue, Y., Li, J., Zou, L., & Tang, M. (2020). Potential health impact of environmental micro- and nanoplastics pollution. Journal of Applied Toxicology, 40(1), 4–15.
https://doi.org/10.1002/jat.3915
|
| [8] |
Cole, M., Lindeque, P., Halsband, C., & Galloway, T. S. (2011). Microplastics as contaminants in the marine environment: A review. Marine Pollution Bulletin, 62(12), 2588–2597.
|
| [9] |
Creswell, J. W. (2014). Research design: Qualitative, quantitative, and mixed methods approaches (4th ed.). SAGE Publications.
|
| [10] |
de Souza Machado, A. A., Kloas, W., Zarfl, C., Hempel, S., & Rillig, M. C. (2018). Microplastics as an emerging threat to terrestrial ecosystems. Global Change Biology, 24(4), 1405–1416.
|
| [11] |
Deme, G. G., Ewusi-Mensah, D., Olagbaju, O. A., Andriessen, H., Assuah, A., Isimbi, A. E., Sintim, E. G., Little-Tetteh, C., Addo, F. G., & Ewusi-Mensah, D. (2022). Macro problems from microplastics: Toward a sustainable policy framework for managing microplastic waste in Africa. Science of the Total Environment, 804, 150170.
https://doi.org/10.1016/j.scitotenv.2021.150170
|
| [12] |
Geissdoerfer, M., Savaget, P., Bocken, N. M. P., & Hultink, E. J. (2017). The circular economy — A new sustainability paradigm? Journal of Cleaner Production, 143, 757–768.
|
| [13] |
Geyer, R., Jambeck, J. R., & Law, K. L. (2017). Production, use, and fate of all plastics ever made. Science Advances, 3(7), e1700782.
|
| [14] |
Global Green Growth Institute (GGGI). (2023). Rwanda plastic waste management and recycling: Field visit report. GGGI Publications.
|
| [15] |
Global Plastics Policy Centre. (2023). The state of global plastic policy. University of Portsmouth.
https://www.globalplasticspolicycentre.com
|
| [16] |
Government of Rwanda. (2019). Law N° 17/2019 of 10/08/2019 relating to the prohibition of manufacturing, importation, use and sale of plastic carry bags and single use plastics. Official Gazette of the Republic of Rwanda.
|
| [17] |
Guerrero, L. A., Maas, G., & Hogland, W. (2013). Solid waste management challenges for cities in developing countries. Waste Management, 33(1), 220–232.
|
| [18] |
Hendricks, C., Olatunji, A., & Gumbi, B. (2024). Microplastics in African aquatic systems: Sources, risks, and management strategies. Journal of Environmental Sciences, 115, 45–57.
|
| [19] |
Hopewell, J., Dvorak, R., & Kosior, E. (2009). Plastics recycling: Challenges and opportunities. Philosophical Transactions of the Royal Society B, 364(1526), 2115–2126.
|
| [20] |
Israel, M. (2014). Research ethics and integrity for social scientists (2nd ed.). SAGE Publications.
|
| [21] |
Izuagba, I., Okoye, C., & Udeh, J. (2019). Plastic waste generation and management practices in Nigerian cities. Waste Management, 85, 295–304.
|
| [22] |
Jackson, T. (2014). Prosperity without growth: Foundations for the economy of tomorrow. Routledge.
|
| [23] |
Jambeck, J. R., Geyer, R., Wilcox, C., Siegler, T. R., Perryman, M., Andrady, A., & Law, K. L. (2015). Plastic waste inputs from land into the ocean. Science, 347(6223), 768–771.
|
| [24] |
Kaza, S., Yao, L. C., Bhada-Tata, P., & Van Woerden, F. (2018). What a waste 2.0: A global snapshot of solid waste management to 2050. Urban Development Series. World Bank.
https://doi.org/10.1596/978-1-4648-1329-0
|
| [25] |
Kothari, C. R. (2004). Research methodology: Methods and techniques (2nd ed.). New Age International.
|
| [26] |
Krueger, R. A., & Casey, M. A. (2015). Focus groups: A practical guide for applied research (5th ed.). SAGE Publications.
|
| [27] |
Lebreton, L., & Andrady, A. (2019). Future scenarios of global plastic waste generation and disposal. Marine Pollution Bulletin, 142, 189–199.
|
| [28] |
Lim, X. (2021). Microplastics are everywhere but are they harmful? Nature, 593(7857), 22–25.
https://doi.org/10.1038/d41586-021-01143-3
|
| [29] |
McDonough, W., & Braungart, M. (2002). Cradle to cradle: Remaking the way we make things. North Point Press.
|
| [30] |
Mhlongo, S., Dube, T., & Moyo, P. (2020). Urban plastic waste dynamics in South Africa. Waste Management & Research, 38(5), 502–511.
|
| [31] |
Morgan, D. L. (1997). Focus groups as qualitative research (2nd ed.). SAGE Publications.
|
| [32] |
Mugenda, O. M., & Mugenda, A. G. (2003). Research methods: Quantitative and qualitative approaches. ACTS Press.
|
| [33] |
Mugenzi, G., Nshimiyimana, J. C., & Uwimana, A. (2023). Economic and operational impacts of Rwanda’s plastic ban on manufacturing businesses. Journal of Environmental Policy & Planning, 25(3), 312–328.
|
| [34] |
Ngarambe, B., Uwimana, N., & Hategekimana, V. (2015). Effectiveness of Rwanda’s plastic bag ban. Environmental Development, 15, 34–42.
|
| [35] |
Niyonzima, D., & Manirakiza, V. (2022). Enforcement outcomes of Rwanda's plastic-ban policy in rural markets. Journal of Environmental Management, 324, 116–130.
|
| [36] |
Njeru, J. (2006). The urban political ecology of plastic-bag waste problem in Nairobi, Kenya. Geoforum, 37(6), 1046–1058.
|
| [37] |
Nunnally, J. C. (1978). Psychometric theory (2nd ed.). McGraw-Hill.
|
| [38] |
OECD. (2022). Global plastics outlook: Policy scenarios to 2060. OECD Publishing.
|
| [39] |
Ochieng, G., Ndegwa, S., & Kamau, P. (2021). Impact of Kenya's plastic bag ban on urban waste streams. Environmental Science & Policy, 120, 45–55.
|
Cite This Article
-
APA Style
Assoumpta, N. M., Ndokoye, P., Atusasire, E. (2026). Investigation on Plastic Wastes in Nyamasheke District, Rwanda: Quantification, Characterization and Management Framework Design. American Journal of Environmental Protection, 15(3), 77-87. https://doi.org/10.11648/j.ajep.20261503.12
 Copy
|
Copy
|
 Download
ACS Style
Assoumpta, N. M.; Ndokoye, P.; Atusasire, E. Investigation on Plastic Wastes in Nyamasheke District, Rwanda: Quantification, Characterization and Management Framework Design. Am. J. Environ. Prot. 2026, 15(3), 77-87. doi: 10.11648/j.ajep.20261503.12
Copy
|
Download
AMA Style
Assoumpta NM, Ndokoye P, Atusasire E. Investigation on Plastic Wastes in Nyamasheke District, Rwanda: Quantification, Characterization and Management Framework Design. Am J Environ Prot. 2026;15(3):77-87. doi: 10.11648/j.ajep.20261503.12
Copy
|
Download
-
@article{10.11648/j.ajep.20261503.12,
  author = {Ntabugi Marie Assoumpta and Pancras Ndokoye and Erasmus Atusasire},
  title = {Investigation on Plastic Wastes in Nyamasheke District, Rwanda: Quantification, Characterization and Management Framework Design},
  journal = {American Journal of Environmental Protection},
  volume = {15},
  number = {3},
  pages = {77-87},
  doi = {10.11648/j.ajep.20261503.12},
  url = {https://doi.org/10.11648/j.ajep.20261503.12},
  eprint = {https://article.sciencepublishinggroup.com/pdf/10.11648.j.ajep.20261503.12},
  abstract = {Plastic waste accumulation in rural markets of developing countries constitutes a critical yet systematically understudied dimension of the global plastic pollution crisis. This study provides the first empirical quantification, characterization, and management assessment of plastic waste in three rural market sectors Kagano, Kanjongo, and Macuba in Nyamasheke District, Rwanda's Western Province. Employing a convergent mixed-methods design combining physical waste audits over 21 sessions, structured questionnaires administered to 400 respondents, key informant interviews, and focus group discussions, the study generated comprehensive market-level evidence on plastic waste generation rates, composition, disposal practices, environmental impacts, and governance gaps. Physical waste audits recorded a combined total of 20.5 kilograms and 7,625 plastic items across the 21-day audit period. Kagano sector generated the highest daily average at 1.66 kg/day, followed by Kanjongo at 0.89 kg/day and Macuba at 0.39 kg/day. Survey data revealed a mean self-reported generation of 3.01 plastic items per respondent per day, with vendors generating significantly more than consumers (t = 2.415, p = 0.016). PET bottles dominated the waste stream at 60.0% by weight, followed by wrappers and sachets at 34.6%. Plastic bags were completely absent from all audit sessions, confirming the sustained effectiveness of Rwanda's landmark 2008 single-use plastic ban. Burning (46.0%) and open dumping (33.5%) accounted for 79.5% of all disposal behavior, with waste segregation virtually absent among 98.5% of respondents. All five environmental impact indicators market littering, drainage blockage, soil and water contamination, air pollution, and livestock risk were observed in 100% of audit sessions. Chi-square analysis revealed highly significant sectoral variation in disposal practices (χ² = 55.333, p < 0.001). A critical awareness-behavior gap was documented: 99.2% of respondents were aware of the plastic ban, yet harmful disposal practices persisted across the study area. Based on these findings, the study proposes a multi-tiered, context-specific plastic waste management framework integrating Extended Producer Responsibility mechanisms, community-based collection infrastructure, sectoral enforcement, and behavioral change interventions. The findings provide actionable evidence to inform Rwanda's transition to a circular economy and offer a replicable methodology for rural market waste assessment across Sub-Saharan Africa.},
 year = {2026}
}
Copy
|
Download
-
TY  - JOUR
T1  - Investigation on Plastic Wastes in Nyamasheke District, Rwanda: Quantification, Characterization and Management Framework Design
AU  - Ntabugi Marie Assoumpta
AU  - Pancras Ndokoye
AU  - Erasmus Atusasire
Y1  - 2026/06/15
PY  - 2026
N1  - https://doi.org/10.11648/j.ajep.20261503.12
DO  - 10.11648/j.ajep.20261503.12
T2  - American Journal of Environmental Protection
JF  - American Journal of Environmental Protection
JO  - American Journal of Environmental Protection
SP  - 77
EP  - 87
PB  - Science Publishing Group
SN  - 2328-5699
UR  - https://doi.org/10.11648/j.ajep.20261503.12
AB  - Plastic waste accumulation in rural markets of developing countries constitutes a critical yet systematically understudied dimension of the global plastic pollution crisis. This study provides the first empirical quantification, characterization, and management assessment of plastic waste in three rural market sectors Kagano, Kanjongo, and Macuba in Nyamasheke District, Rwanda's Western Province. Employing a convergent mixed-methods design combining physical waste audits over 21 sessions, structured questionnaires administered to 400 respondents, key informant interviews, and focus group discussions, the study generated comprehensive market-level evidence on plastic waste generation rates, composition, disposal practices, environmental impacts, and governance gaps. Physical waste audits recorded a combined total of 20.5 kilograms and 7,625 plastic items across the 21-day audit period. Kagano sector generated the highest daily average at 1.66 kg/day, followed by Kanjongo at 0.89 kg/day and Macuba at 0.39 kg/day. Survey data revealed a mean self-reported generation of 3.01 plastic items per respondent per day, with vendors generating significantly more than consumers (t = 2.415, p = 0.016). PET bottles dominated the waste stream at 60.0% by weight, followed by wrappers and sachets at 34.6%. Plastic bags were completely absent from all audit sessions, confirming the sustained effectiveness of Rwanda's landmark 2008 single-use plastic ban. Burning (46.0%) and open dumping (33.5%) accounted for 79.5% of all disposal behavior, with waste segregation virtually absent among 98.5% of respondents. All five environmental impact indicators market littering, drainage blockage, soil and water contamination, air pollution, and livestock risk were observed in 100% of audit sessions. Chi-square analysis revealed highly significant sectoral variation in disposal practices (χ² = 55.333, p < 0.001). A critical awareness-behavior gap was documented: 99.2% of respondents were aware of the plastic ban, yet harmful disposal practices persisted across the study area. Based on these findings, the study proposes a multi-tiered, context-specific plastic waste management framework integrating Extended Producer Responsibility mechanisms, community-based collection infrastructure, sectoral enforcement, and behavioral change interventions. The findings provide actionable evidence to inform Rwanda's transition to a circular economy and offer a replicable methodology for rural market waste assessment across Sub-Saharan Africa.
VL  - 15
IS  - 3
ER  -
Copy
|
Download